California Spanish Assessment Content
Sample SSR
Sample SSRs are provided here. The callouts on the samples correspond with the links in the numbered list. Select a link for more information about that section of the SSR.
Note the following about the CSA sample SSRs:
- Data displayed on the samples in this guide are for demonstration purposes only and may not reflect valid data.
- Sample SSRs may include minor variances from actual SSRs.
- Sample SSRs are presented for both grade five (to represent grades three through eight) and grade eleven (to represent the high school grade band).
Refer to the CSA Reporting Criteria subsection for information about the criteria required for a student to receive an SSR.
Page 1
Page 1 of the CSA SSR is presented in figure 1 (for a grade-level assessment—in this case, grade five) and figure 2 (for a high school assessment).
- Student Information
- Overall CSA Score
- What Is the CSA?
- What Do the Scores Mean?
- Additional Resources
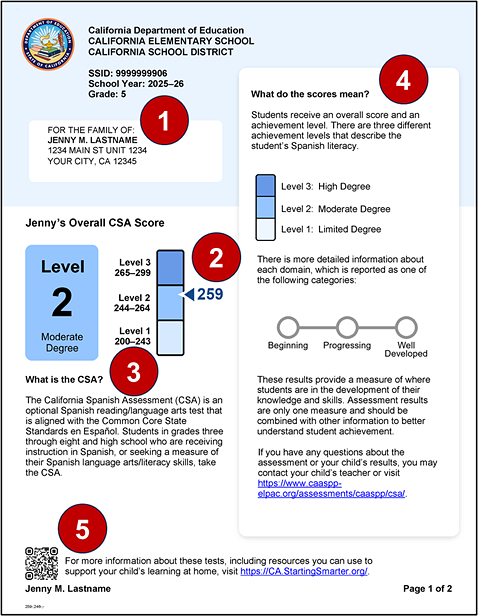
Figure 1. Sample CSA SSR, page one (grades three through eight)
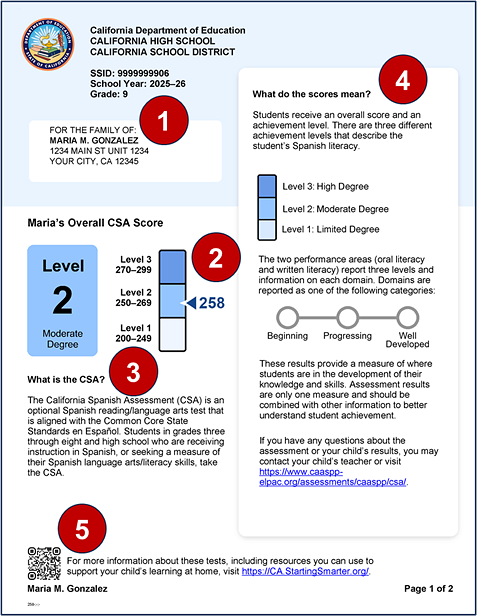
Figure 2. Sample CSA SSR, page one (high school grade band)
Page 2
Page 2 of the CSA SSR is presented in figure 3 (for a grade-level assessment) and figure 4 (for a high school assessment).
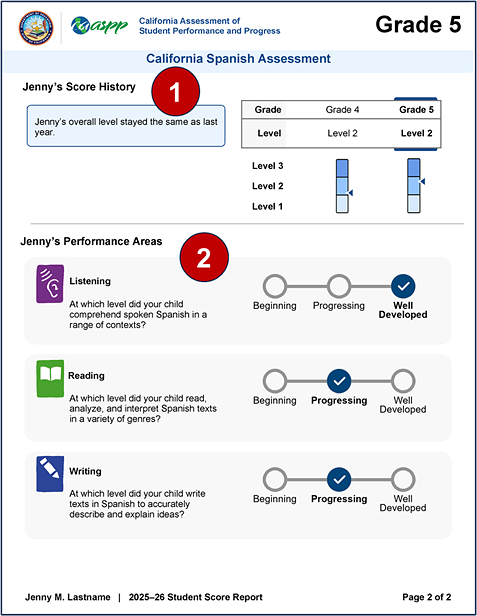
Figure 3. Sample CSA SSR, page two (grades three through eight)
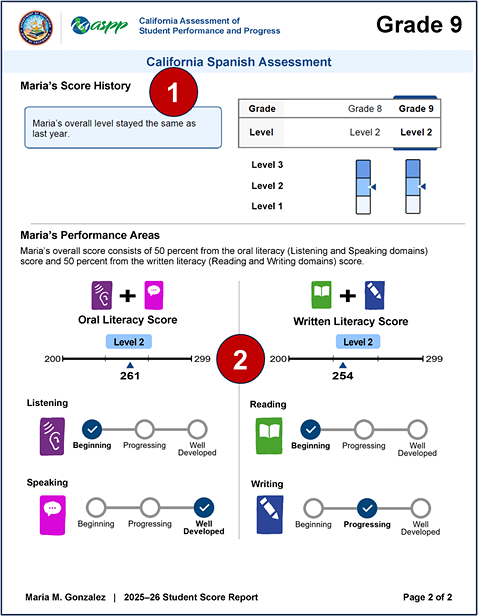
Figure 4. Sample CSA SSR, page two (high school grade band)
Description
The SSR for the CSA, which provides parents/guardians with the student’s results, is described in table 1.
| Feature | Description |
|---|---|
|
Purpose |
To show a student’s achievement on the CSA to students and parents/guardians |
|
Format |
|
|
Action |
Pursuant to 5 CCR Section 863, LEAs must notify parents/guardians and make SSRs available within 20 working days of its delivery to the LEA in TOMS. If the LEA receives the SSRs after the last day of instruction for the school year, the LEA shall make the SSR available to the parent/guardian no later than the first 20 working days of the new academic year. |
The SSR for the CSA provides parents/guardians with the student’s results.
Information about the CSA is provided for students in grades three through eight and high school (grades nine through twelve).
Data presented for the CSA includes the following:
- Scale scores
- Achievement levels:
- Level 3—High Degree
- Level 2—Moderate Degree
- Level 1—Limited Degree
- Composite achievement levels (high school grade band only):
- Level 3
- Level 2
- Level 1
- Domain performance levels:
- Well Developed
- Progressing
- Beginning
- Scale score ranges
- Scale score and achievement level for a previous year’s assessment(s) (if available)
Front Page
The front page of an SSR always contains the student information and additional information described in the Common CAASPP and ELPAC SSR Page 1 General Information section in addition to the content described in the rest of this subsection.
What Is the CSA?
Each CSA SSR contains a brief program overview (figure 5), including why it is administered.
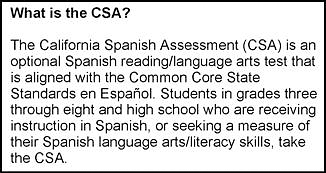
Figure 5. Program overview
What Do the Scores Mean?
CSA reporting includes three achievement levels that are in the following order from top to bottom:
- Level 3—High Degree
- Level 2—Moderate Degree
- Level 1—Limited Degree
Each CSA SSR contains a description of what the overall and domain reporting levels mean; figure 6 shows this section for grade five.
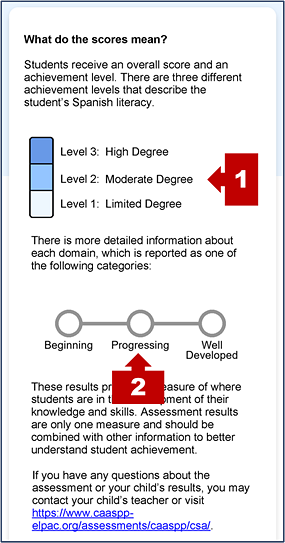
Figure 6. Scores information (grade five)
| # | Feature | Description |
|---|---|---|
|
1 |
Achievement level measurement gauge |
A gauge is divided into three parts, each representing one of the achievement levels, from Level 1 to Level 3. In the “Overall” section on the left (under the student information), an indicator with the student’s score places the score within one of the achievement levels (figure 7). |
|
2 |
Performance levels |
A list of performance level descriptors for the CSA domains is presented. |
Score Overview
The CSA SSR contains common elements.
Because the CSA is aligned with the CCSS en Español, which are a translated and linguistically augmented version of the CCSS for English Language Arts & Literacy, scores cannot be compared between assessments for different content areas (for example, between mathematics and the CSA).
Scale score ranges that express student achievement are different for each grade level and the grade band, and the expectations for instruction, which are aligned with the standards, for the next grade level are more challenging than for the previous grade level. As a result, an increase in the overall score may not mean a higher level of achievement for the current year.
Under certain circumstances, such as when a student does not respond to enough questions in a domain, the performance area score is “No Score.” The possible message and its associated reason are presented in table 3.
| Reason | Message |
|---|---|
|
Invalid |
[Student’s name]’s scores should be used with caution as the test was administered under conditions that may not represent [Student’s name]’s achievement. |
|
No Score |
There were not enough questions answered to report [Student’s name]’s achievement in all performance areas. |
Overall Score
This section, which is presented in figure 7, shows the student’s score relative to the score range for the assessment. These are indicated in text and on a measurement gauge.
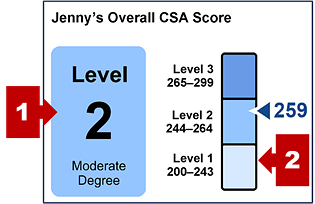
Figure 7. Overall CSA score
| # | Feature | Description |
|---|---|---|
|
1 |
Achievement level |
This indicator summarizes the student’s achievement level for the CSA. |
|
2 |
Achievement level measurement gauge |
A gauge is divided into three parts, each representing one of the achievement levels, from Level 1 to Level 3. An indicator with the student’s score places the score within the scale score range for one of the three achievement levels. |
|
2 |
Special condition (Not shown) |
A cautionary message also will be included at the bottom of the page for one of the following reasons:
|
Score History
Scores are presented for a student’s prior results on the CSA (figure 8). Note the following about this section:
- “Not Tested” appears if a registered student does not have a score for a particular year (grade level).
- A score history is not shown for a student in grade three, who is taking the CSA for the first time.
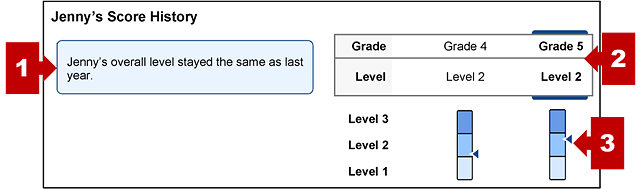
Figure 8. Student score history
| # | Feature | Description |
|---|---|---|
|
1 |
Progress summary |
This paragraph summarizes the student’s progress based on the student’s achievement level for the prior year. Summaries are listed in the Progress Summary Text subsection. |
|
1 |
Special condition (Not shown) |
A cautionary message also will be included under the progress summary for one of the following reasons:
|
|
2 |
Score history table |
Student scores and achievement levels are presented in a table that shows, from left to right, the student’s score one year ago and as reported for the current test administration year. If the student is in grade three for the first time—that is, the student is not repeating grade three—this table will be replaced with the message, “[Name] took this test for the first time this school year. [Name] will have score history next school year.” |
|
3 |
Achievement level measurement gauges |
Gauges with an arrow showing the student’s achievement level within one of the three sections for each of the reported test administrations are presented immediately under the table in columns that align with the grade level reported. |
Progress Summary Text
This section includes text noting the student’s achievement in relationship to the grade level’s achievement standard. This section also includes progress summary text for students comparing the current year’s results with the previous year’s results and noting whether the student stayed within the previous year’s achievement level. Possible progress summary text for students is as follows:
- [Student’s name]’s overall level decreased from last year.
- [Student’s name]’s overall level stayed the same as last year.
- [Student’s name]’s overall level increased from last year.
Performance Areas (Domains and Composites)
Scores are shown for the CSA domains and composites the students took. Domains and composites are based on the content standards, which describe what students know and can do at each grade level.
Domain Performance Areas
For students in all grade levels, this chart shows performance levels for CSA domains (figure 9). A check mark indicates a student’s domain performance level, either Beginning, Progressing, or Well Developed. Three domains are reported for grades three through eight and four domains are reported for the high school grade band.
When there is “No Score” for a domain performance area, there is a double asterisk and an accompanying footnote that says, “**There were not enough questions answered to report [Student’s name]’s achievement in all performance areas.”
SSRs include domain performance area results for the following domains:
- Listening
- Reading
- Writing
- Speaking (high school grade band only)
There are three possible performance levels for the domain reporting:
- Well Developed
- Progressing
- Beginning
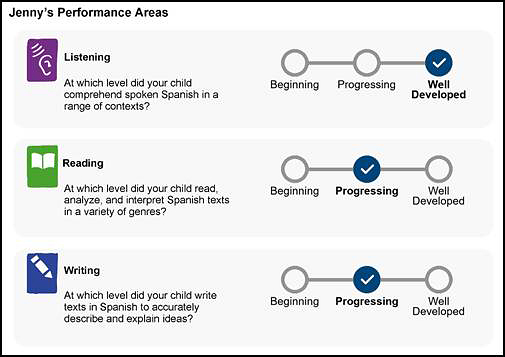
Figure 9. Domain performance summary (grade five)
Composite Achievement Levels
For students in the high school grade band only, this region of the SSR shows performance levels for CSA domains and achievement levels for composites (figure 10).
Composite Domains
Composites for the high school grade band are as follows:
- Oral literacy:
- Listening
- Speaking
- Written literacy:
- Reading
- Writing
For the composite scores, there are three possible achievement levels (figure 10):
- Level 3
- Level 2
- Level 1
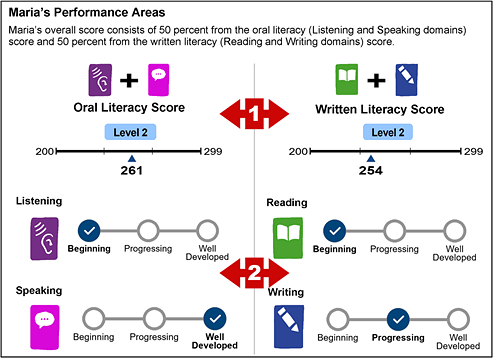
Figure 10. Score performance-area summary (high school grade band)
| # | Feature | Description |
|---|---|---|
|
1 |
Composite scores |
The title in each section displays the name of the composite score—either oral literacy (combined listening and speaking domains) or written literacy (combined reading and writing domains)—as well as a line graph showing the composite scale score and its placement within the score range. Each composite makes up 50 percent of the student’s overall score. |
|
2 |
Domain performance |
This section of the chart shows performance levels for the assessment’s domains; a check mark indicates a student’s domain performance level—either Beginning, Progressing, or Well Developed. |
Additional Messaging—Special Indicators
In cases where a student did not respond to a sufficient number of questions within both domains within a composite, the student cannot receive a composite score. In this case, the composite’s achievement-level line graph is replaced with “No Score~” and a footnote indicates the following:
~Not enough [composite] literacy questions were answered to receive a composite score; therefore, the lowest score was used to calculate the overall score.
The performance-level indicator section for a domain where not enough questions were answered is replaced with “No Score**” and a footnote indicates the following:
There were not enough questions answered to report [Student’s name]’s achievement in all performance areas.
Figure 11 provides an example of how these indicators would appear within a composite’s reporting on page two of the SSR. In the example the composite line graph is replaced with “No Score~”, and the performance-level sections for reading and writing are marked “No Score**”.
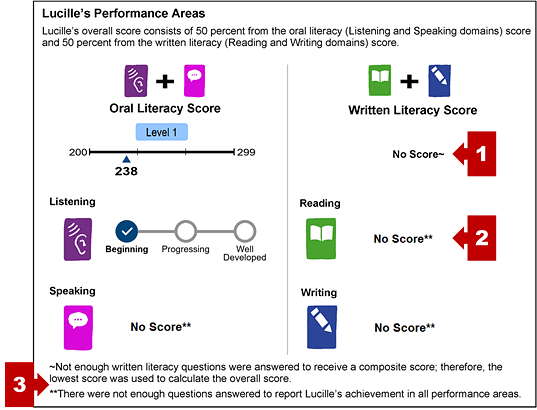
Figure 11. Domain indicators within a composite
| # | Feature | Description |
|---|---|---|
|
1 |
Composite score indicator |
The “No Score~” indicator that appears only when the student did not answer enough questions in the two domains to receive a score for the composite. |
|
2 |
Domain performance indicator |
The “No Score**” indicator that appears only when the student did not answer enough questions in a domain to receive a performance level for the domain. |
|
3 |
No-score messages |
The message corresponding with the composite score indicator and the domain performance indicator are presented in footnotes. |